pytorch如何实现多项式回归 pytorch实现多项式回归代码示例
作者:袖梨
2022-06-25
pytorch如何实现多项式回归?本篇文章小编给大家分享一下pytorch实现多项式回归代码示例,文章代码介绍的很详细,小编觉得挺不错的,现在分享给大家供大家参考,有需要的小伙伴们可以来看看。
一元线性回归模型虽然能拟合出一条直线,但精度依然欠佳,拟合的直线并不能穿过每个点,对于复杂的拟合任务需要多项式回归拟合,提高精度。多项式回归拟合就是将特征的次数提高,线性回归的次数使一次的,实际我们可以使用二次、三次、四次甚至更高的次数进行拟合。由于模型的复杂度增加会带来过拟合的风险,因此需要采取正则化损失的方式减少过拟合,提高模型泛化能力。希望大家可以自己动手,通过一些小的训练掌握pytorch(案例中有些观察数据格式的代码,大家可以自己注释掉)
# 相较于一元线性回归模型,多项式回归可以很好的提高拟合精度,但要注意过拟合风险
# 多项式回归方程 f(x) = -1.13x-2.14x^2+3.12x^3-0.01x^4+0.512
import torch
import matplotlib.pyplot as plt
import numpy as np
# 数据准备(测试数据)
x = torch.linspace(-2,2,50)
print(x.shape)
y = -1.13*x - 2.14*torch.pow(x,2) + 3.15*torch.pow(x,3) - 0.01*torch.pow(x,4) + 0.512
plt.scatter(x.data.numpy(),y.data.numpy())
plt.show()

# 此时输入维度为4维
# 为了拼接输入数据,需要编写辅助数据,输入标量x,使其变为矩阵,使用torch.cat拼接
def features(x): # 生成矩阵
    # [x,x^2,x^3,x^4]
    x = x.unsqueeze(1)
    print(x.shape)
    return torch.cat([x ** i for i in range(1,5)], 1)
result = features(x)
print(result.shape)
# 目标公式用于计算输入特征对应的标准输出
# 目标公式的权重如下
x_weight = torch.Tensor([-1.13,-2.14,3.15,-0.01]).unsqueeze(1)
b = torch.Tensor([0.512])
# 得到x数据对应的标准输出
def target(x):
    return x.mm(x_weight) + b.item()

# 新建一个随机生成输入数据和输出数据的函数,用于生成训练数据

def get_batch_data(batch_size):
    # 生成batch_size个随机的x
    batch_x = torch.randn(batch_size)
    # 对于每个x要生成一个矩阵
    features_x = features(batch_x)
    target_y = target(features_x)
    return features_x,target_y

# 创建模型
class PolynomialRegression(torch.nn.Module):
    def __init__(self):
        super(PolynomialRegression, self).__init__()
        # 输入四维度 输出一维度
        self.poly = torch.nn.Linear(4,1)

    def forward(self, x):
        return self.poly(x)

# 开始训练模型
epochs = 10000
batch_size = 32
model = PolynomialRegression()
criterion = torch.nn.MSELoss()
optimizer = torch.optim.SGD(model.parameters(),0.001)

for epoch in range(epochs):
    print("{}/{}".format(epoch+1,epochs))
    batch_x,batch_y = get_batch_data(batch_size)
    out = model(batch_x)
    loss = criterion(out,batch_y)
    optimizer.zero_grad()
    loss.backward()
    # 更新梯度
    optimizer.step()
    if (epoch % 100 == 0):
        print("Epoch:[{}/{}],loss:{:.6f}".format(epoch,epochs,loss.item()))
    if (epoch % 1000 == 0):
        predict = model(features(x))
        print(x.shape)
        print(predict.shape)
        print(predict.squeeze(1).shape)
        plt.plot(x.data.numpy(),predict.squeeze(1).data.numpy(),"r")
        loss = criterion(predict,y)
        plt.title("Loss:{:.4f}".format(loss.item()))
        plt.xlabel("X")
        plt.ylabel("Y")
        plt.scatter(x,y)
        plt.show()
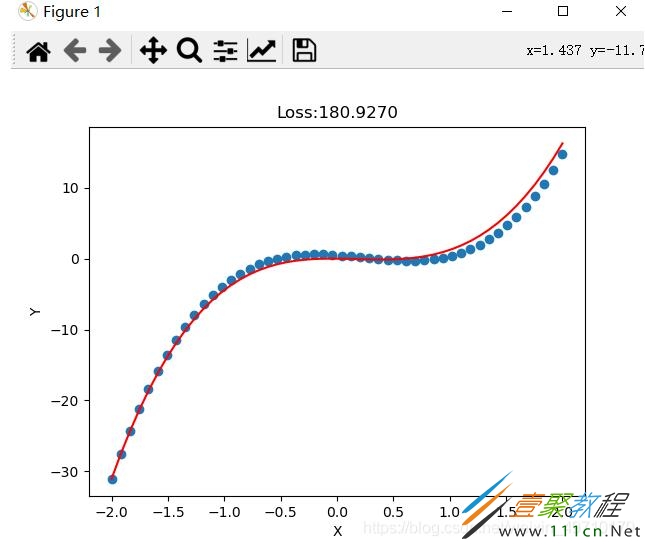
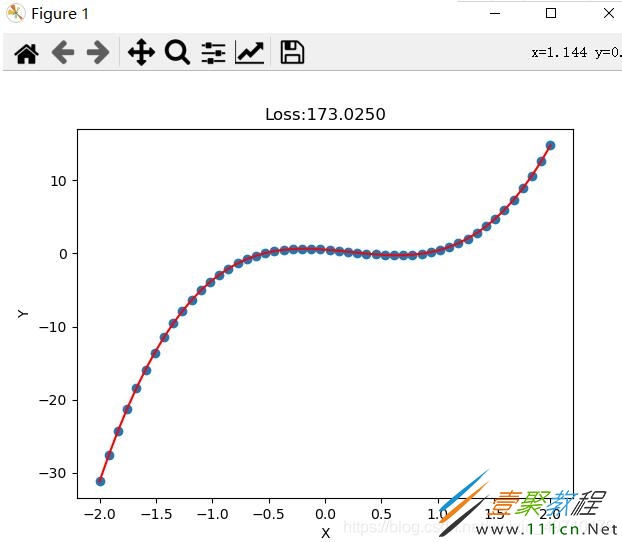
拟合结果:


