python opencv图像的高通滤波和低通滤波代码示例
作者:袖梨
2022-06-25
本篇文章小编给大家分享一下python opencv图像的高通滤波和低通滤波代码示例,文章代码介绍的很详细,小编觉得挺不错的,现在分享给大家供大家参考,有需要的小伙伴们可以来看看。
代码如下
低通滤波
import cv2
import numpy as np
import matplotlib.pyplot as plt

# cv2.imread()在读取图像的时候,默认的是读取成RGB图像,cv2.IMREAD_GRAYSCALE将以灰度图的形式读取
img = cv2.imread('./moon.jpg', flags = cv2.IMREAD_GRAYSCALE)
# 将图像除以255是为了将图像向数字准换成fioat32数据
img1 = img/255
# 进行傅里叶变换,时域——>频域
dtf = cv2.dft(img1, flags = cv2.DFT_COMPLEX_OUTPUT)
# 移动低频波到中心位置
dft_shift = np.fft.fftshift(dtf)

# 低通滤波
h,w = img.shape
# 图像中心点即低频波所在位置
h2, w2 = h//2, w//2
mask = np.zeros((h,w,2), dtype=np.uint8)
# 选取长宽为100的区域的低频部分为1,其余部分为0
mask[h2-50:h2+50,w2-50:w2+50] = 1

# 低频部分保留,其余部分*0被滤掉
dft_shift*=mask
# 傅里叶逆变换,频域——>时域
ifft_shift2 = np.fft.ifftshift(dft_shift)
result = cv2.idft(ifft_shift2)

# 创建显示窗口,显示原图
plt.figure(figsize=(12,9))
plt.subplot(121)
plt.imshow(img, cmap = 'gray')

# 创建显示窗口,显示低通滤波后的图像
plt.subplot(122)
plt.imshow(result[:,:,0], cmap='gray')
plt.show()
高通滤波
高通滤波和低通滤波的主要区别在于,低通滤波是保留中心的低频波去除高频波,高通滤波是去除中心的低频波保留高频波。
import cv2
import numpy as np
import matplotlib.pyplot as plt

# cv2.imread()在读取图像的时候,默认的是读取成RGB图像,cv2.IMREAD_GRAYSCALE将以灰度图的形式读取
img = cv2.imread('./moon.jpg', flags = cv2.IMREAD_GRAYSCALE)
# 将图像除以255是为了将图像向数字准换成fioat32数据
img1 = img/255
# 进行傅里叶变换,时域——>频域
dtf = cv2.dft(img1, flags = cv2.DFT_COMPLEX_OUTPUT)
# 移动低频波到中心位置
dft_shift = np.fft.fftshift(dtf)

# 高通滤波
h,w = img.shape
# 图像中心点即低频波所在位置
h2, w2 = h//2, w//2  # 中心点
# 选取长宽为100的区域的低频部分为0,其余高频部分为1
dft_shift[h2-5:h2+5,w2-5:w2+5] = 0
# 傅里叶逆变换,频域——>时域
ifft_shift2 = np.fft.ifftshift(dft_shift)
result = cv2.idft(ifft_shift2)

# 创建显示窗口,显示原图
plt.figure(figsize=(12,9))
plt.subplot(121)
plt.imshow(img, cmap = 'gray')

# 创建显示窗口,显示低通滤波后的图像
plt.subplot(122)
plt.imshow(result[:,:,0], cmap='gray')
plt.show()
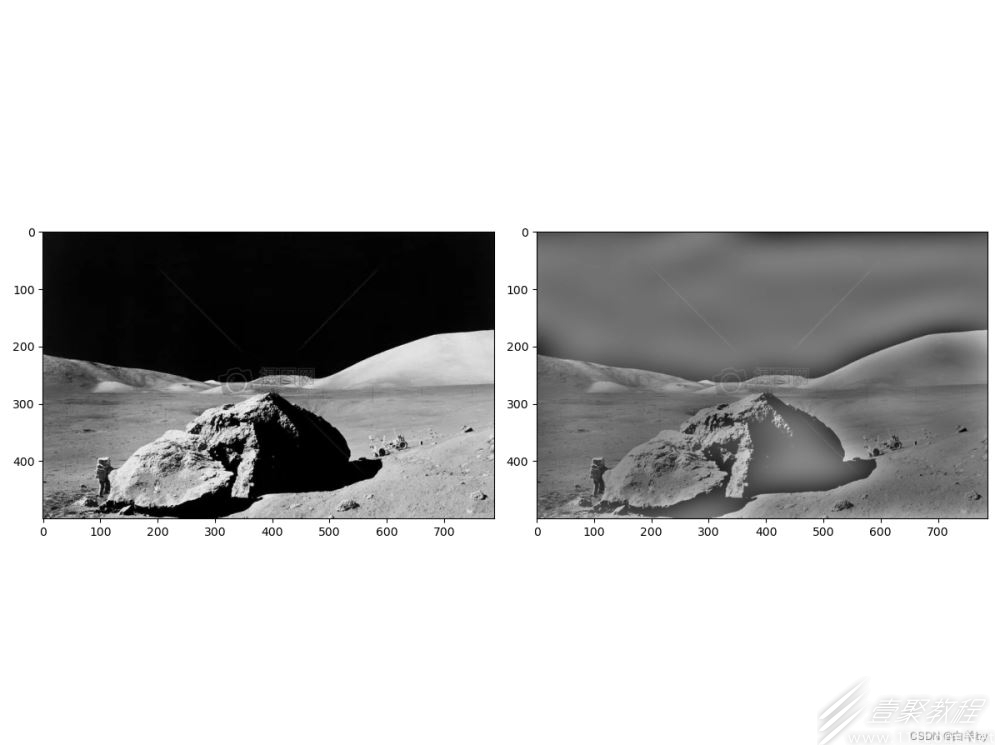
结果展示
改变滤波区域的大小可以改变滤波的程度,可以修改如图所示的代码中的相关部分:
低通滤波
高通滤波


