pythonXarray处理设置二维数组作为coordinates方式
作者:袖梨
2026-09-24
这篇文章主要介绍了pythonXarray处理设置二维数组作为coordinates方式,具有很好的参考价值,希望对大家有所帮助。如有错误或未考虑完全的地方,望不吝赐教
python Xarray处理设置二维数组作为coordinates
因为想做笔记,所以直接做的很粗糙了,后面再更新!
import cv2import numpy as npfrom osgeo import gdalimport osimport xarray as xr import matplotlib.pyplot as pltimport matplotlib as mplfig, ax = plt.subplots(figsize=(6, 1))fig.subplots_adjust(bottom=0.5)cmap = mpl.cm.coolnorm = mpl.colors.Normalize(vmin=5, vmax=10)fig.colorbar(mpl.cm.ScalarMappable(norm=norm, cmap=cmap), cax=ax, orientation='horizontal', label='Some Units')"""res = cv2.resize(RasterArrray, dsize=(441,251), interpolation=cv2.INTER_CUBIC)Here img is thus a numpy array containing the original image, whereas res is a numpy array containing the resized image. An important aspect is the interpolation parameter: there are several ways how to resize an image. Especially since you scale down the image, and the size of the original image is not a multiple of the size of the resized image. Possible interpolation schemas are:INTER_NEAREST - a nearest-neighbor interpolationINTER_LINEAR - a bilinear interpolation (used by default)INTER_AREA - resampling using pixel area relation. It may be a preferred method for image decimation, as it gives moire'-free results. But when the image is zoomed, it is similar to the INTER_NEAREST method.INTER_CUBIC - a bicubic interpolation over 4x4 pixel neighborhoodINTER_LANCZOS4 - a Lanczos interpolation over 8x8 pixel neighborhood"""def GetTimeSerises_nc(ncVariable): """ 获取 时间序列 :param ncVariable: :return: """timeSerises = ncVariable.time.datareturn timeSerisesinNcFile = r"./solar-1979-01.nc"inNc = xr.open_dataset(inNcFile)print(inNc)print(inNc.LATIXY.data)import pandas as pd # 创建 datasetds = xr.Dataset()numLon = 1400numLat = 800# LATIXY LONGXYinLat = inNc.LATIXY.datainLon = inNc.LONGXY.data# print("np.min(inLon):{}, np.max(inLon):{}".format(np.min(inLon), np.max(inLon)))# print("np.min(inLat):{}, np.max(inLat):{}".format(np.min(inLat), np.max(inLat)))lon = np.linspace(np.min(inLon), np.max(inLon), num=numLon, endpoint=True, retstep=False, dtype=None, axis=0)lat = np.linspace(np.min(inLat), np.max(inLat), num=numLat, endpoint=True, retstep=False, dtype=None, axis=0)lon, lat = np.meshgrid(lon, lat)ds = ds.assign_coords({ "lat": (["x", "y"], lat), "lon": (["x", "y"], lon)})solor = np.full(shape=(10, numLat, numLon) , fill_value= np.nan )ncVariable = inNc.FSDStimeSerises = GetTimeSerises_nc(ncVariable)i = 0for timeSerise in timeSerises[0:10]: print(timeSerise) # 获取数据 arr = inNc.FSDS.loc[timeSerise].data print(arr.shape) solor[i,:,:] = cv2.resize(arr, dsize=(numLon,numLat), interpolation = cv2.INTER_LINEAR) print(arr.shape) i= i+1 print(i)ds["solor"] = xr.DataArray(solor, dims=['time','x', 'y'], )ds.coords['time'] = pd.date_range(start='1979-01-01',periods=10,freq='3H')# ds["lat"] = xr.DataArray(lat, dims=['lat'], )# ds["lon"] = xr.DataArray(lon, dims=['lon'], )print(ds)ds.to_netcdf(r"./test_1.nc")
主要解决问题的代码块在这里:
lon = np.linspace(np.min(inLon), np.max(inLon), num=numLon, endpoint=True, retstep=False, dtype=None, axis=0)lat = np.linspace(np.min(inLat), np.max(inLat), num=numLat, endpoint=True, retstep=False, dtype=None, axis=0)lon, lat = np.meshgrid(lon, lat)ds = ds.assign_coords({ "lat": (["x", "y"], lat), "lon": (["x", "y"], lon)})ds["solor"] = xr.DataArray(solor, dims=['time','x', 'y'], )ds.coords['time'] = pd.date_range(start='1979-01-01',periods=10,freq='3H')
结果:
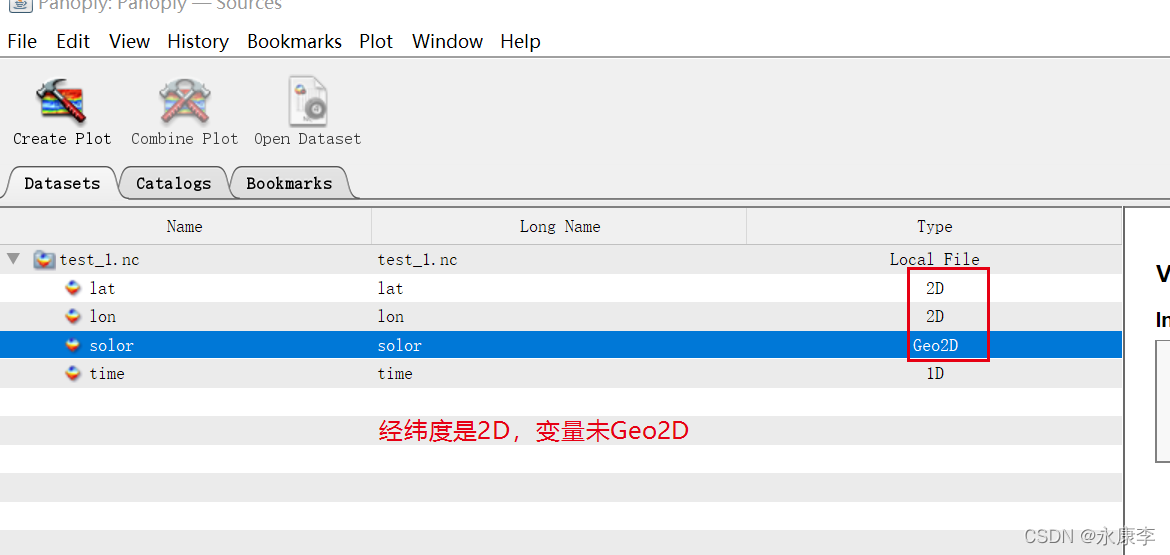
参考链接https://st*ac*kove*rflow.com/questions/67695672/xarray-set-new-2d-coordinate-as-dimension
Xarray(python)读取Sentinel-5P(S5P)哨兵数据
需求分析:NC文件的常规包netcdf4使用手感较xarray略显笨拙,故尝试使用xarray读取包含Group的.nc4文件
数据:S5P二级数据:S5P_RPRO_L2__HCHO, 来源:欧洲哥白尼,或NASA(推荐,因为好下载)
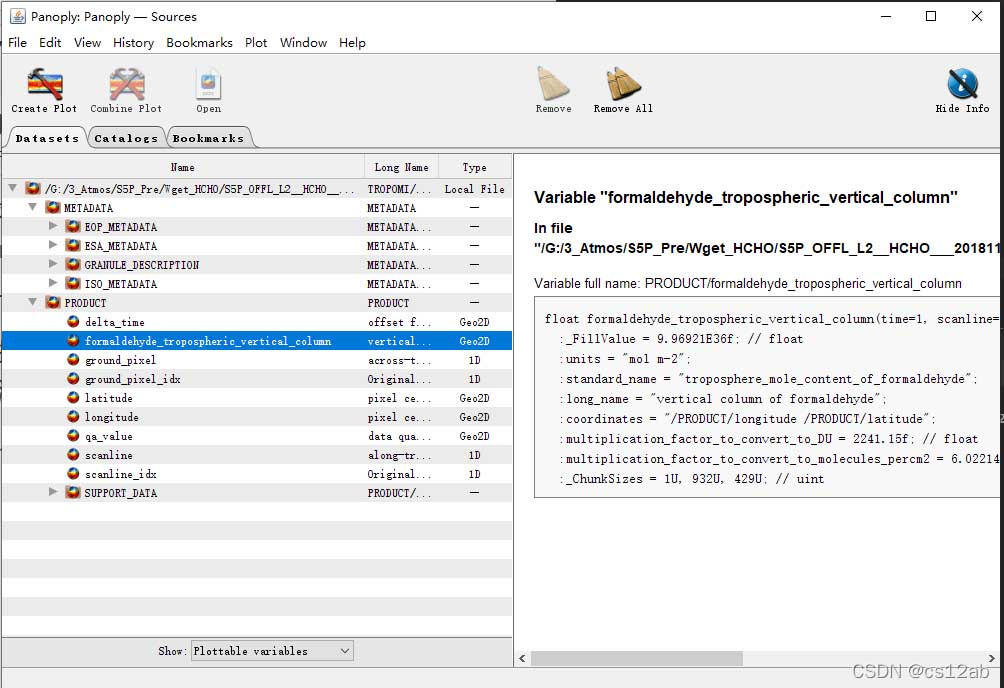
使用panoly可视化
(1)导入后的界面:
(2)选择变量后,点击Create Plot按钮可视化:
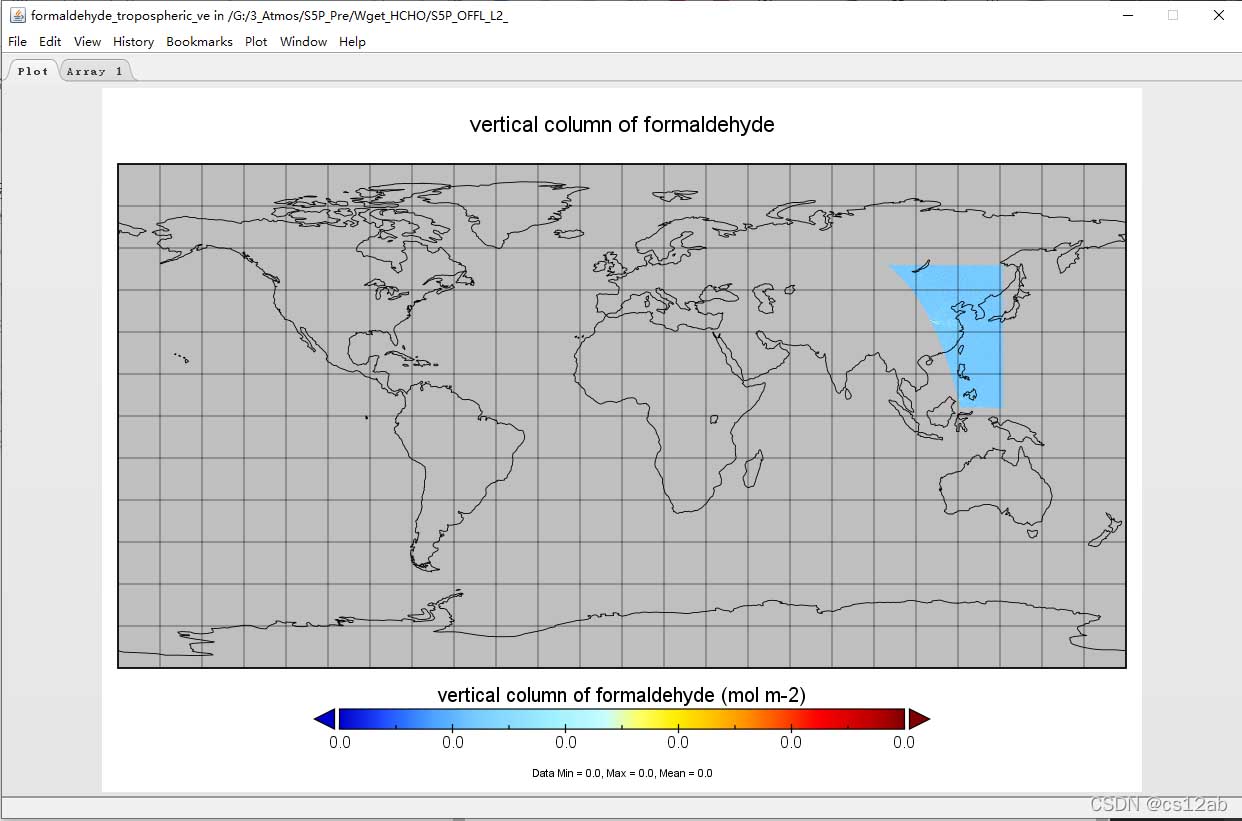
即可得到HCHO的Plot图以及Array可视化。
使用python里的工具包读取
import osimport xarray as xrimport netCDF4 as nc # 对于nc4文件,其内含groups,Dir = ['../S5P_Pre/Wget_HCHO'] # 时间跨度180514 ~ 190805file = os.listdir(Dir[0])file.sort(key = lambda x:int(x.split('___')[1][:8])) # 按年月日排序# (1)使用nc包打开ns = nc.Dataset(os.path.join(Dir[0], file[0])) #这里的数据存储在groups里面的PRODUCT里面hcho = ns['PRODUCT']['formaldehyde_tropospheric_vertical_column'][:]# (2) 使用xarray包打开 —— 推荐方式xs = xr.open_dataset(os.path.join(Dir[0], file[0]), group = 'PRODUCT') # 这里需用group函数指定组名称
(1)netcdf4的读取结果:
In[29]: nsOut[29]: Subset parameters: {"PRODUCT": ["S5P_L2__HCHO__.1"], "INFILENAMES": ["S5P_RPRO_L2__HCHO___20180514T023918_20180514T042246_03018_01_010105_20190203T205044.nc"], "INFILETYPE": ["nc"], "OUTFILETYPE": ["nc4"], "TIMENAME": [["TROP2010", "/PRODUCT/time", "/PRODUCT/delta_time"]], "VARNAMES": ["/PRODUCT/formaldehyde_tropospheric_vertical_column", "/PRODUCT/qa_value", "/PRODUCT/time_utc", "/PRODUCT/scanline", "/PRODUCT/ground_pixel"], "BOXLONRANGE": [73.0, 136.0], "BOXLATRANGE": [3.0, 54.0], "TIMERANGE": [800414432.0, 800496009.0], "GRIDTYPES": ["SWATH"], "CONVERTFILETYPE": [true]} dimensions(sizes): variables(dimensions): groups: PRODUCT, METADATAIn[30]: ns['PRODUCT']Out[30]: <class 'netCDF4._netCDF4.Group'>group /PRODUCT: dimensions(sizes): time(1), scanline(725), ground_pixel(237) variables(dimensions): uint16 time_idx(time), uint16 scanline_idx(scanline), uint16 ground_pixel_idx(ground_pixel), float32 longitude(time,scanline,ground_pixel), float32 latitude(time,scanline,ground_pixel), int32 time(time), int32 delta_time(time,scanline,ground_pixel), float32 formaldehyde_tropospheric_vertical_column(time,scanline,ground_pixel), uint8 qa_value(time,scanline,ground_pixel), <class 'str'> time_utc(time,scanline), int32 scanline(scanline), int32 ground_pixel(ground_pixel) groups: SUPPORT_DATAIn[31]: ns['PRODUCT'].variables.keys()Out[31]: dict_keys(['time_idx', 'scanline_idx', 'ground_pixel_idx', 'longitude', 'latitude', 'time', 'delta_time', 'formaldehyde_tropospheric_vertical_column', 'qa_value', 'time_utc', 'scanline', 'ground_pixel'])
(2) xarray的读取结果:
xsOut[34]: <xarray.Dataset>Dimensions: (ground_pixel: 237, scanline: 725, time: 1)Coordinates: * time (time) datetime64[ns] 2018-05-14 * scanline (scanline) float64 1.507e+03 .... * ground_pixel (ground_pixel) float64 1.0 ......Data variables: time_idx (time) float32 0.0 scanline_idx (scanline) float32 1.506e+03 .... ground_pixel_idx (ground_pixel) float32 0.0 ...... longitude (time, scanline, ground_pixel) float32 ... latitude (time, scanline, ground_pixel) float32 ... delta_time (time, scanline, ground_pixel) timedelta64[ns] ... formaldehyde_tropospheric_vertical_column (time, scanline, ground_pixel) float32 ... qa_value (time, scanline, ground_pixel) float32 ... time_utc (time, scanline) object nan .....
不足使用xarray读取含Groups的嵌套文件如.nc4时
需要先知道其所在的Gropus名称,即需要先用panoly软件或nc4包打开。
总结
以上为个人经验,希望能给大家一个参考,也希望大家多多支持一聚教程网。